Patient DEMO-001
Samples received
| Sample | Collected | Cancer fraction | Analysis completed |
|---|---|---|---|
| Plasma cfDNA | 27 Sep 2020 | 81% | Prostate cancer panel |
Somatic mutations
| Gene | Mutation | Biological effect | Allele% |
|---|---|---|---|
| PIK3R1 | chr5:68297446 A → T | Stopgain p.K311X | 51.6% |
| TP53 | chr17:7675237 C → A | Splice site | 79.1% |
| RNF43 | chr17:58360800 C → A | Stopgain p.E151X | 61.1% |
Allele fraction is defined as the number of DNA fragments displaying the somatic mutation, divided by the total number of DNA fragments overlapping the position. Chromosomal coordinates refer to the hg38 reference genome.
Somatic copy number changes
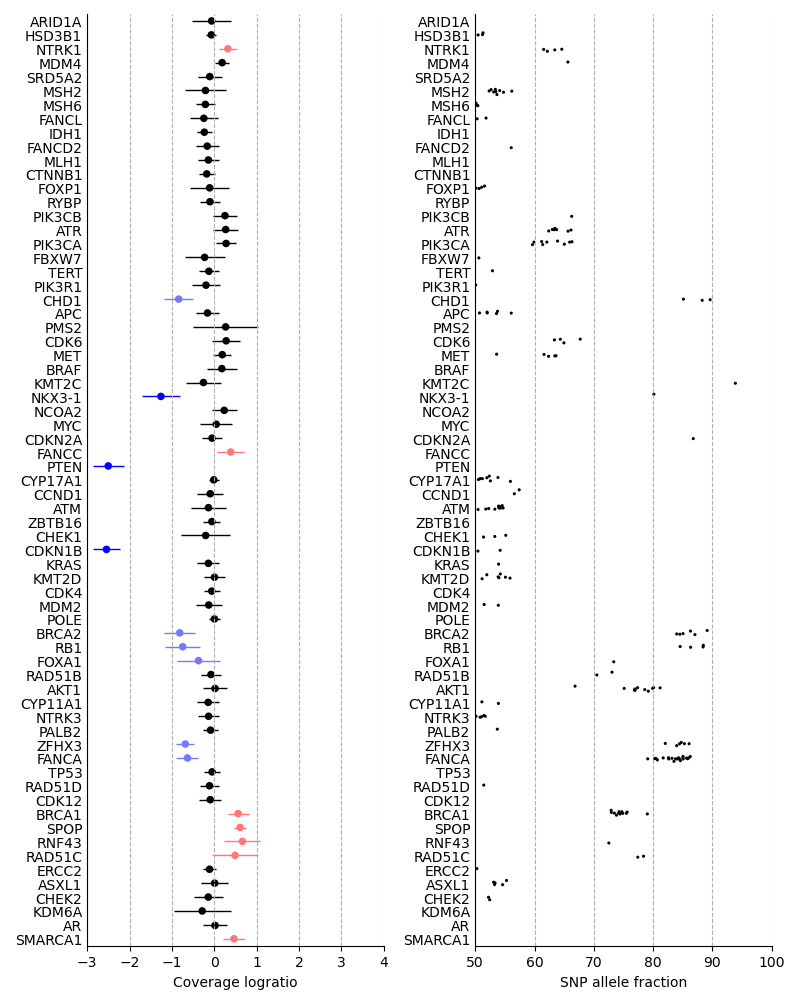
The left-hand side of this visualization shows the relative quantity of DNA fragments originating from genes targeted by the panel. Genes with a coverage logratio less than -0.3 or greater than 0.3 are highlighted with color. The genes are ordered by genomic position. 95% confidence intervals are shown as horizontal whiskers.
The right-hand side shows the allele fractions of heterozygous SNPs found inside the genes. Each heterozygous SNP is shown as a black dot.
Androgen receptor copy number profile
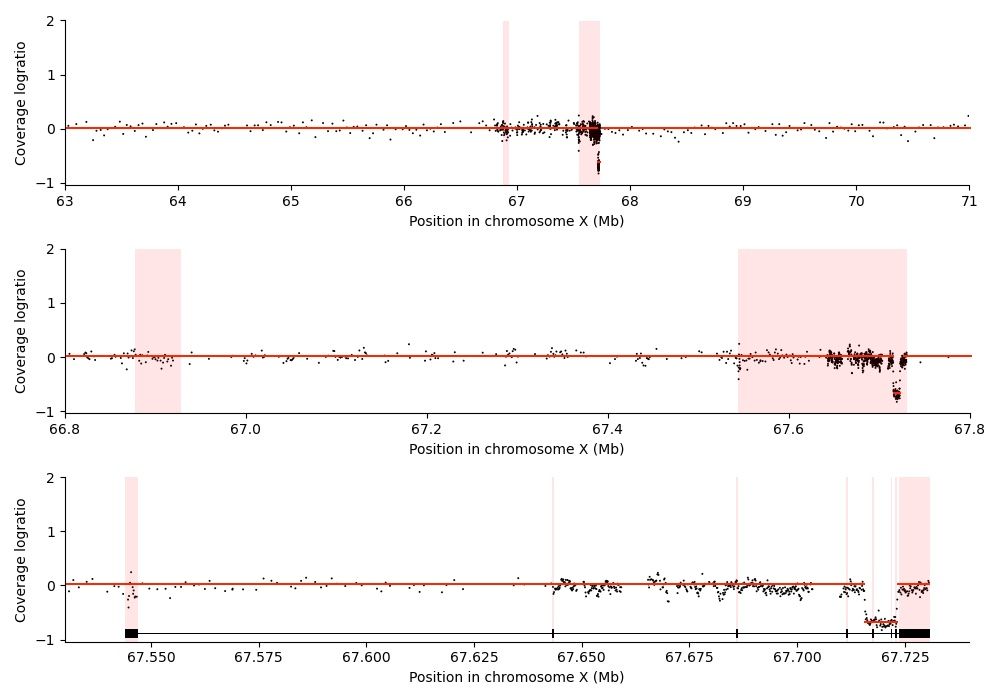
This visualization shows the relative quantity of DNA fragments originating from different genomic loci surrounding the androgen receptor (AR) gene. Three different zoom levels are shown. In the top and middle panel, the AR enhancer and the AR gene body are highlighted in red. In the bottom panel, AR exons are highlighted in red. Chromosomal coordinates refer to the hg38 reference genome.
Genome-wide copy number profile
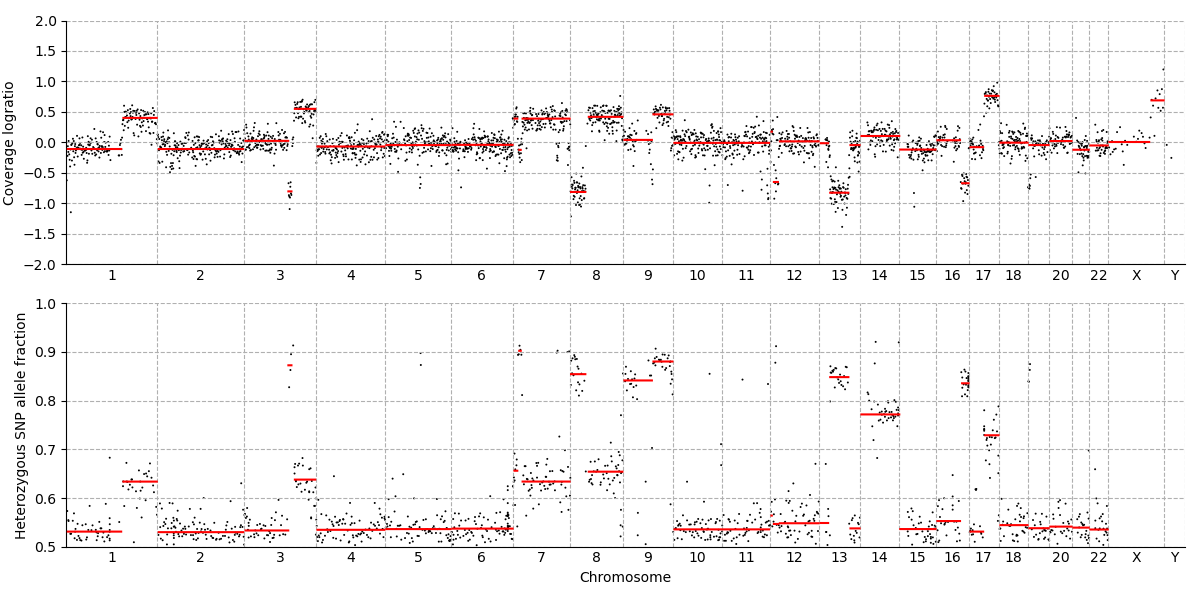
The top panel of this visualization shows the relative quantity of DNA fragments originating from 3000 evenly spaced regions across the genome. The bottom panel shows the allele fraction of heterozygous SNPs.
Somatic chromosomal rearrangements
| Biological effect | Representative DNA fragment | Supporting fragments |
|---|---|---|
| 62 bp deletion overlapping TP53 TSS | AGCTACCTGCTCCCTGGACGGTGGCTCTAGACTTTTGAGAAGCTCAAAACTTTTAGCGCCAGTCTTGAGCACACGCCATGACAAGTAAGGGCAAGTAATCCGCCTGCCGGAGGAAGCAAAGGAAATGGAGTTGGGGAGGAGGGTGCAGAGT | 37 |
| 7.3 kb deletion overlapping AR exons 5 - 7 | ATTTCTCTGGCCCTCATGTTCCTTGTTGGTAAAATAAGTGCCACATCACCTAACCTCTGGGATTATTGTGCCATTCCCCTCTGGCTTTGAGTGTGGTCCAGGAAGAAAATGTGGTGAAGAAAAGAACACGGGTC | 46 |
This table lists somatic chromosomal rearrangements identified through the presence of anomalous DNA fragments that contain sequence from two or more different genomic regions. Chromosomal coordinates refer to the hg38 reference genome.
Germline variants
| Gene | Allele | Effect | Population frequency |
|---|---|---|---|
| PMS2 | chr7:5987328 G → C | Heterozygous missense p.H373Q. Likely benign. | 0.57% |
| BRCA2 | chr13:32339592 C → CT | Heterozygous stopgain p.N1747*. Pathogenic. | N/A |
| ZFHX3 | chr16:72950770 G → A | Heterozygous missense p.S58L. Benign. | 0.37% |
This table shows all rare protein altering germline variants (population frequency < 0.5%) detected in this patient's genome.
About the prostate cancer panel
The Fluivia comprehensive prostate cancer assay detects somatic mutations, copy number changes, rearrangements and germline variants in 66 prostate cancer genes. The test can be used with circulating tumor DNA, fresh frozen cancer tissue, or FFPE cancer tissue. The assay interrogates all genes that are recurrently altered at the DNA level in prostate cancer, including genes related to hormonal signaling, steroid synthesis, cell cycle regulation, DNA repair, PI3K and WNT signaling. The panel provides a detailed view of genomic alterations at the androgen receptor (AR) locus, covering all AR exons and introns 3 - 7 to enable detection of intragenic rearrangements. The panel also interrogates the structure of AR locus amplifications using a high resolution (30 kb) probe grid. The assay also estimates a genome-wide copy number profile at 300 kb resolution, enabling absolute copy number quantification and detection of genome duplication events.
| Gene | Analyzed regions |
|---|---|
| AKT1 | Coding regions |
| APC | Coding regions |
| AR | Coding regions + introns 3 - 7 + flanking regions |
| ARID1A | Coding regions |
| ASXL1 | Coding regions |
| ATM | Coding regions |
| ATR | Coding regions |
| BRAF | Coding regions |
| BRCA1 | Coding regions |
| BRCA2 | Coding regions |
| CCND1 | Coding regions |
| CDK12 | Coding regions |
| CDK4 | Coding regions |
| CDK6 | Coding regions |
| CDKN1B | Coding regions |
| CDKN2A | Coding regions |
| CHD1 | Coding regions |
| CHEK1 | Coding regions |
| CHEK2 | Coding regions |
| CTNNB1 | Coding regions |
| CYP11A1 | Coding regions |
| CYP17A1 | Coding regions |
| ERCC2 | Coding regions |
| FANCA | Coding regions |
| FANCC | Coding regions |
| FANCD2 | Coding regions |
| FANCL | Coding regions |
| FBXW7 | Coding regions |
| FOXA1 | Coding regions |
| FOXP1 | Coding regions |
| HSD3B1 | Coding regions |
| IDH1 | Coding regions |
| KDM6A | Coding regions |
| KMT2C | Coding regions |
| KMT2D | Coding regions |
| KRAS | Coding regions |
| MDM2 | Coding regions |
| MDM4 | Coding regions |
| MED12 | Coding regions |
| MET | Coding regions |
| MLH1 | Coding regions |
| MSH2 | Coding regions |
| MSH6 | Coding regions |
| MYC | Coding regions |
| NCOA2 | Coding regions |
| NKX3-1 | Coding regions |
| PALB2 | Coding regions |
| PIK3CA | Coding regions |
| PIK3CB | Coding regions |
| PIK3R1 | Coding regions |
| PMS2 | Coding regions |
| POLE | Coding regions |
| PTEN | Coding regions |
| RAD51B | Coding regions |
| RAD51C | Coding regions |
| RAD51D | Coding regions |
| RB1 | Coding regions |
| RNF43 | Coding regions |
| RYBP | Coding regions |
| SMARCA1 | Coding regions |
| SPOP | Coding regions |
| SRD5A2 | Coding regions |
| TERT | Promoter region |
| TP53 | Coding regions |
| ZBTB16 | Coding regions |
| ZFHX3 | Coding regions |
| Whole genome | Probes tiled at 300 kb intervals for genome-wide copy number analysis |